Showing posts with label probability. Show all posts

Friday, 19 May 2017

Exploring the difference between averages

Two tasks designed to get pupils thinking about the different averages and how they are affected by new numbers added to a set. It preempts this lesson on which average you should use and why. Its also quite a nice bit of cross-curricular thinking.

Task 1 - Averages and probability (editable files here)


Task 2 - Match the averages to the description


Friday, 6 June 2014

The False-Positive Paradox as a Class Activity/Discussion Point

There is a test that screens for some rare disease (only 1 in every million people is infected). It is 99% accurate (it gives the correct answer of positive or negative 99% of the time). You go for the test and to your dismay it returns a positive result!
What is the chance that you actually have the disease?

You may think that its pretty likely you have the disease. However, from the information above, the actual probability that you have the disease is still very unlikely (1 in 10'102). This is the basic premise of the false-positive paradox.

I don't really like that it is named as a paradox, because it is not actually in any way paradoxical, just counter-intuitive. It works because there are so many more non-infected people (999'999) that each have a 1% chance of getting a false positive than the number of infected people (1) who has a 99% chance of getting a true positive result.


This counter-intuition can cause exactly the sort of cognitive-disonance that can be so useful in getting people to realise that their current understanding needs improving, but in its current form its pretty wordy, inaccessible and abstract. I wanted to make it in to a class activity. Instructions below.


How to run the Class Activity/Discussion Point:

  • As students enter the room, give them each a slip of paper with a random word on it. Tell them not to show anyone else.
  • Once they're settled, tell them that there is a (make-believe) disease going round school that only affects about one student per class. In this class the one student, the one with the word banana on their slip of paper, is infected (Don't tell anyone if its you or not!).
  • Tell them you have a way of checking if anyone has the disease, but its not always accurate. To perform the test, you will ask the student if they are infected. Before answering, the student will roll a dice and will tell the truth if they roll a 1, 2, 3, 4 or 5, but they will lie if they roll a 6.
  • Perform this test on some students until someone claims to be infected.
  • Ask the class how likely is it that this student is actually infected. Ask for justifications. Most will say very likely, some may evan say 5/6.
  • Perform the test on a few more students until you get a few more claiming to be infected.
  • But they can't all be 'very likely'! What is going on here? 

By the way, make sure the students know the disease is not real!


Would this work in your classroom? Could it be improved? At the moment its just an idea and I'd like to know what you think.

Tuesday, 18 March 2014

Lesson Sketch: Probability - a matter of life and death

"In 1999 a woman in the UK, Sally Clark, was convicted of murdering her two children. They had both seemingly died from SIDS (more commonly known as cot death), an unexpected but natural cause of death.

One of the main pieces of evidence against her was the testimony of a Professor and expert on child-abuse. He used the probability of one child (in a family with no known factors that might increase the chance of SIDS) dying of SIDS (1 in 8543). He then squared this fraction to get the probability of BOTH children dying from SIDS being about 1 in 73 million.

The jury saw this number as the probability of an innocent explanation and, since it was so low, found her guilty of the murders. Unfortunately the professor who testified was not an expert on probability and miscalculated. The jury also did not understand the meaning of the statistic being calculated and drew the wrong conclusions from it.

In this series of lessons we will look at why this probability of 1 in 73 million is both wrong and irrelevant to the case. We will also look at how probability could have been properly used in this case."

This is the introduction to a series of lessons on probability.This case will frame the students' work on probability throughout the unit and not one student will ask "when am I ever going to use this?"

There are many options on how open or closed a project this is. Because I was short on time (being interviewed) I first asked them if they could spot any problems in the probability (useful for showing progression) before working in quite a closed manner, as a class, through section 1**.

Section 1 - Improbable events never happen

Introduce expected frequency of events. After students understand the general concept and are able to calculate the expected frequency of different events. Get them to work on the questions below:
The probability that both babies in a family of two will die of cot-death is 1/73'000'000.
There are about 340 million families with two children in the world.
1) How many families would you expect both babies to die of cot-death?

The probability of winning the lottery is 1/14'000'000.
About 7.5 million people play the lottery each week
2) How many winners would you expect to get:
i) Each week
ii) Each month
iii) Each year
iv) In 10 years

The probability of being born with 11 fingers or toes is 1/500.
3) What other information do you need to estimate the number of people in Bristol who were born with 11 fingers or toes?

4) Look at your answer to question 1. How is it related to the court case mentioned earlier? Does the answer to question 3 help you decide whether the woman was innocent or guilty?

5) Since the probability that both babies in a family of two will die naturally is 1/73'000'000, does that mean that the probability that both were murdered is 72'999'999/73'000'000? Explain why/why not?


I then got students to discuss question 4 in pairs before sharing with the group.
Concepts to get across:
  • Probability is an estimate of frequency and whether something will happen or not depends a lot on the number of trials.
  • Probability can not say for certain whether she is guilty or not as unlikely events do happen (though we can't be sure that's what happened here).
  • The 73 million outcomes will include mostly families where neither child has died or a single child has died.

You could also go in to relative frequency here. This may help students understand where the 1 in 8543 statistic might have come from.

Section 2 - Dependent and Independent Events

Here you need to go in depth about the difference between dependent and independent events. Pupils need to be able to distinguish between the two, have some understanding about how the outcome of one event can change the probability of other events (e.g. if it rains today I am less likely to hang my washing out) and how to draw a probability tree from conditional probability problems.

What does this have to do with the case? Well, the probability of 1 in 8543 can only be squared if the death of the two children are independent events (otherwise the probability of the second death would be a different fraction). The causes of SIDS is not entirely known, but it is highly plausible that there could be genetic or environmental factors that would be common to the two children. This would mean that if there were a SIDS death in a family, then further SIDS deaths would be more likely than otherwise.

Students can work on these questions to see this in action*:
1a. The probability that a family's first baby will die of cot-death is 1/8543.
If the first baby dies of cot-death, the probability that the second will also die of cot-death is 1/442.
If the first baby DOES NOT die of cot-death, the probability that the second will die of cot-death is 1/11002.
Draw a probability tree to show this information.

b. What is the probability that:
 i. Neither child dies of cot-death?
 ii. One of the children die of cot-death?
 iii. Both children die of cot-death?

c. Using the number of families in the world with two children from the previous lesson (340 million), calculate how many families would you expect both babies to die of cot-death?

d. Why might the probability that the second child will die of cot-death be affected by whether the first child has also died of cot-death?

Section 3 - Further Conditional Probability

Now we get in to Bayes' theorem and the real reason why the 1 in 37 million statistic is simply irrelevant to the case:

As seen in question 5 from section one, the probability of 1 in 73'000'000, even if it were correct, is not the probability of innocence. It would instead be the probability that if you picked any random family of two children, both children would have died AND the cause of death was cot-death. This is not appropriate to use in this case because we already know that both children died.

Again, pupils could first work on standard conditional probability questions until they are comfortable with the function and usage of the above formula. Then pupils are going to calculate the probability that both children have died of cot-death GIVEN that both children have died. They can also compare this to the probability that both children were murdered GIVEN that both children have died:

The probability that both children in a family of two will be murdered is 1 in 10 million.
1. What is the probability that both children will die of cot-death OR murder (use the probability calculated in the previous session).

2. What is the probability that both children have died of cot-death given that both children have died of EITHER cot-death OR murder?

2. What is the probability that both children have been murdered given that both children have died of EITHER cot-death OR murder?

3. How do these two probabilities compare?

4. How does this change your view of the case?

5. Does this help you decide whether the woman was innocent or guilty? How?

Wrapping it up

A great way to recap all of this would be to get the students to prepare a letter to send to the judge of the case explaining the ways in which probability has been misused in this case and in what ways the calculations could be improved upon.
What is particularly great about this is that when they are done you can compare their letters to the letter written by the The Royal Statistical Society voicing their concerns (here) or the more specific letter written by Professor A.P. Dawid (of the R.S.S.) for her (successful) appeal (here)

Comments and Thoughts

*Although many of the figures used above are directly from the court case, and some are estimates based on other data I was able to find online, some of the data is currently unavailable and therefore is made up and should be used purely for illustration purposes.


**How I would prefer to run it:
  • Start each class recapping previous work and ideas on the case
  • Introduce the topic of the lesson and work on standard questions of that topic
  • Ask students: "how this topic might be related to the case? What data would we need to apply today's skills to this case?"
  • Give them the data they ask for and let them do the calculations.
  • Ask students: "How does this new information change your view of the case? Does this help you decide whether the woman is innocent or guilty? Why?"

There are many other problems with the probability used in the case including (but definitely not limited to):
  • Some environmental factors were included in the calculation, which make the probability of cot-death less likely, but many other factors in this individual case (which could increase the risk of cot-death) were not included.
  • Cot-death is not the only alternative cause of death to the theorised double-murder, but the probability of these other causes of death were not included.
  • The study where the 1 in 8543 figure came from was not intended for use in a criminal trial and instead is looking at possible causes of cot-death. It does not, therefore, directly apply to this case.

I thought for some time about the ethics of using a real, living person's tragedy as the basis for a Maths lesson. However, since this particular miscarriage of justice is due solely to the misunderstanding of basic probability by many of the involved parties, its use to encourage a better understanding of this topic seems appropriate. I wouldn't want to involve this in a quick and easy pseudo-context question. Instead it should be handled with the importance and gravitas it deserves.

Here are some other links about this case:
  • Wikipedia
  • UnderstandingUncertainty.org
  • Berkeley University - This one is my favourite. Though it is more complex than some of the others, it has a lot more information about the lack of data in some areas and the assumptions that need to be made in order to make the calculations work. Interestingly, this paper argues that the probability of double-murder is much higher (over 99%) than stated in any of the letters endorsed by the R.S.S. (the point still stands, however, that statistics, if used in court at all, should be verified and reviewed by professionals).
  • Bad Science

Sunday, 3 March 2013

Lesson Sketch: Who Wrote This?

I'm excited about this lesson idea! So excited that it had me tweeting J.K. Rowling and Stephen Fry (though I didn't get a reply yet from either). I hope you like it as much as my pupils did last week.

Act 1

Get pupils to read this letter:

Dear ___________,
I'm so sorry to hear that life is getting you down at the moment. Goodness knows, it can be so tough when nothing seems to fit and little seems to be fulfilling. I'm not sure there's any specific advice I can give that will help bring life back its savour. Although they mean well, it's sometimes quite galling to be reminded how much people love you when you don't love yourself that much. I've found that it's of some help to think of one's moods and feelings about the world as being similar to weather:
Here are some obvious things about the weather:

It's real.
You can't change it by wishing it away.
If it's dark and rainy it really is dark and rainy and you can't alter it.
It might be dark and rainy for two weeks in a row.

BUT

It will be sunny one day.
It isn't under one's control as to when the sun comes out, but come out it will.
One day.

It really is the same with one's moods, I think. The wrong approach is to believe that they are illusions. They are real. Depression, anxiety, listlessness - these are as real as the weather - AND EQUALLY NOT UNDER ONE'S CONTROL. Not one's fault.

BUT

They will pass: they really will.
In the same way that one has to accept the weather, so one has to accept how one feels about life sometimes. "Today's a crap day," is a perfectly realistic approach. It's all about finding a kind of mental umbrella. "Hey-ho, it's raining inside: it isn't my fault and there's nothing I can do about it, but sit it out. But the sun may well come out tomorrow and when it does, I shall take full advantage."
I don't know if any of that is of any use: it may not seem it, and if so, I'm sorry. I just thought I'd drop you a line to wish you well in your search to find a little more pleasure and purpose in life.

Very best wishes, ____________
Tell them that it was written by one of the following people:
J.K. Rowling Lewis Carroll Stephen Fry
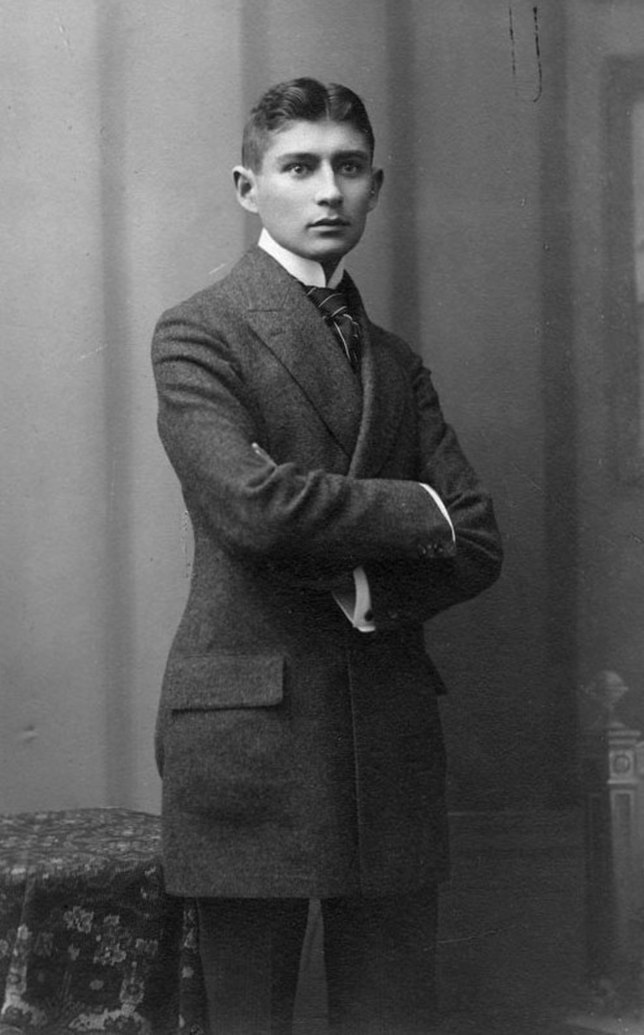
Russell Brand Franz Kafka Fyodor Dostoevsky

Let them discuss who they think it might be and why. Ask if there are any we could discount straight away. (note: I feel that I should have more women up there. Can you think of any women authors that all the kids would know?)
They will talk about writing styles and uses of certain words and things they know about the lives of these authors (I've purposefully used people for whom it would be understandable that they would have written such a letter).

Act 2

We are going to try to use their writing styles to determine who wrote it. What sort of things could we measure about their writing styles? (Some) Possible answers:
  • How often they use certain words/punctuation marks (make sure the words chosen are common enough to be in other writings and not specific to the context).
  • Average sentence length.
  • Average paragraph length.
We will also need some samples to measure these things on. I'd use the previews you can get on Google Books:
This task works best if each group measures and compares a different word or aspect of the writing as it creates for some great discussions about which measurements hold more weight and why.

Act 3

Write a table of the techniques each group used and the conclusion they made from it. Decide as a group who we think it is. By this point my students were desperate to know who wrote it. Talking points:
  • Accuracy and how we could have obtained better estimates.
  • Which techniques should hold most weight? Why?
  • Why is "The Beadle and the Bard" probably not as useful to use as "The Fry Chronicles"?
  • Where might this technique be used outside the classroom?
Reveal the answer: Tadaa!
After this you might also want to show how historians have used this exact same technique (and its name: Stylometry)!

Final Notes: When I used this in class, with student written essays rather than a famous letter, it worked exceptionally well. As I said, pupils were desperate to know who wrote the essay by the end. It fell down a little at the end as I didn't have a good way to show the answer. Making it about celebrities (I think) makes the answer more interesting.
The reason I tweeted Fry and Rowling was to try to get a school essay from them (the story would be that I have an old school essay from a celebrity and I could sell it if only I could remember which of these people had written it). This letter works well and is a great and interesting bit of writing in itself. The only problem I have with it is that students could quite easily Google part of the text and get the answer.

What about you? How could you improve it?

Tuesday, 26 June 2012

Lesson Sketch: Relative frequency - A lesson on calculating the risks of sport

Another basic one here. Why do it? Because you can't repeat the 'checking to see if a dice is fair' activity year on year forever. Step one - Ask pupils to put a list of common sports in to the order of how dangerous they think the sports are:

American Football, Football, Gymnastics, Ice Hockey, Swimming, Wrestling, Field Hockey, Skiing, Water Polo, Equestrian, Golf, Skydiving

Step 2 - Show the number of deaths for each sport and proclaim American Football to be the most dangerous!

Sports
Deaths in US colleges in the last 5 years in five years
American Football
55
Football
6
Gymnastics
1
Ice Hockey
1
Swimming
8
Wrestling
3
Field Hockey
0
Skiing
2
Water Polo
1
Equestrian
1
Golf
0

Ask what is wrong with your statement. Why have so many more people died in American Football than any of the others? Get that we also need to know how many people actually took part. Show them the third column of the table along with the formula for relative frequency:


Sports
Deaths in colleges
in five years
Participation in colleges
in five years
American Football
55
2’079’069
Football
6
841’963
Gymnastics
1
57’613
Ice Hockey
1
128’898
Swimming
8
475’953
Wrestling
3
188’272
Field Hockey
0
156’370
Skiing
2
33’974
Water Polo
1
39’968
Equestrian
1
10’489
Golf
0
62’528

Pupils put the sports in order of their danger of death. One thing I like about this is that the data (got from here) is not really adequate for most of them and it gives plenty of room for discussion.


Step 3 - Show pupils this pdf: http://www.uspa.org/Portals/0/MembershipSurveys/memsurvey09.pdf

Ask how we can work out the relative frequency of deaths in skydiving using this data. Pupils will probably go for the 16 deaths over 2.5 million jumps, but for the result to be comparable to the previous task it would make more sense to do the number of deaths over the 32'177 members. This is because all the other sports will be played throughout the year and it is counted as deaths per participant rather than deaths per game. An interesting and fairly advanced conversation to be having with your pupils - YAY!

Quick wins from Direct Instruction: Dimensions of Difficulty

This post was inspired by an episode of the Craig Barton podcast with Kris Boulton. Kris was acting as a salesman for Engelmann's Direct...